The lottery bell curve: we tested the "central range" on 1,430 Powerball draws
On players' forums and in some paid software, one idea keeps coming back: the sum of the drawn numbers follows a bell curve, so you should play tickets whose sum falls in the middle, where 75 to 80% of draws land. We checked it on every Powerball draw since the rule change of 7 October 2015, then ran a backtest.
Two curves not to confuse
Powerball draws 5 numbers from 69 and one Powerball from 26. Taken one by one, the numbers form no bell at all: each should come up about 104 times in 1,430 draws, and the actual counts range from 79 to 128. A chi-square test gives p = 19%: these differences are just chance.
The sum of the 5 numbers does form a bell. There is only one way to get 15 (1+2+3+4+5), but tens of thousands of ways to get 175. Of the 11,238,513 possible combinations, 78.06% have a sum between 119 and 226. In the actual draws, 77.6% landed in that range: exactly what simply counting the combinations predicts.
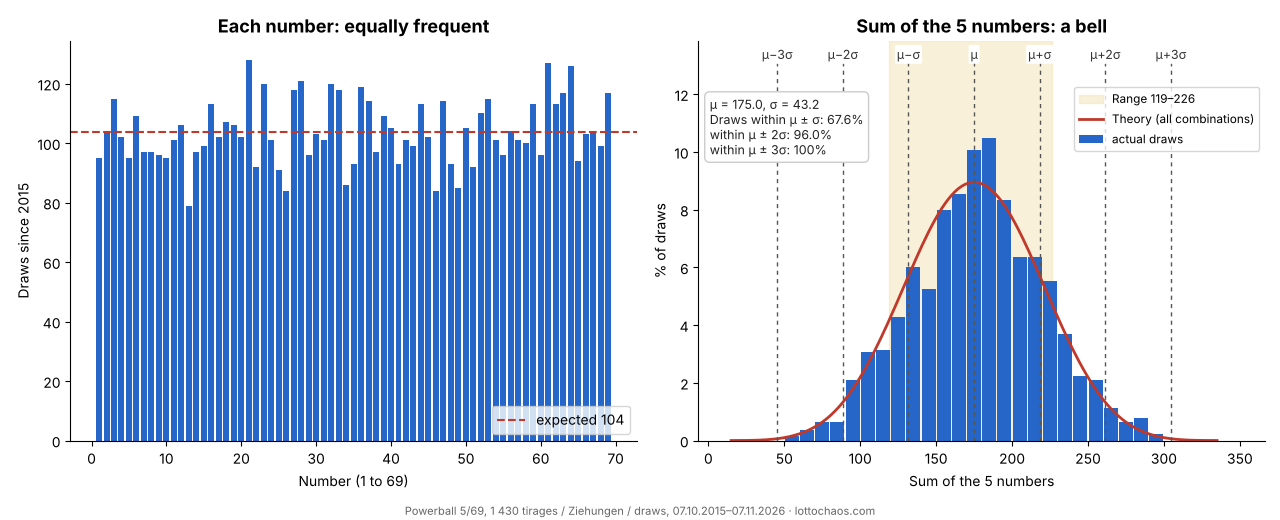
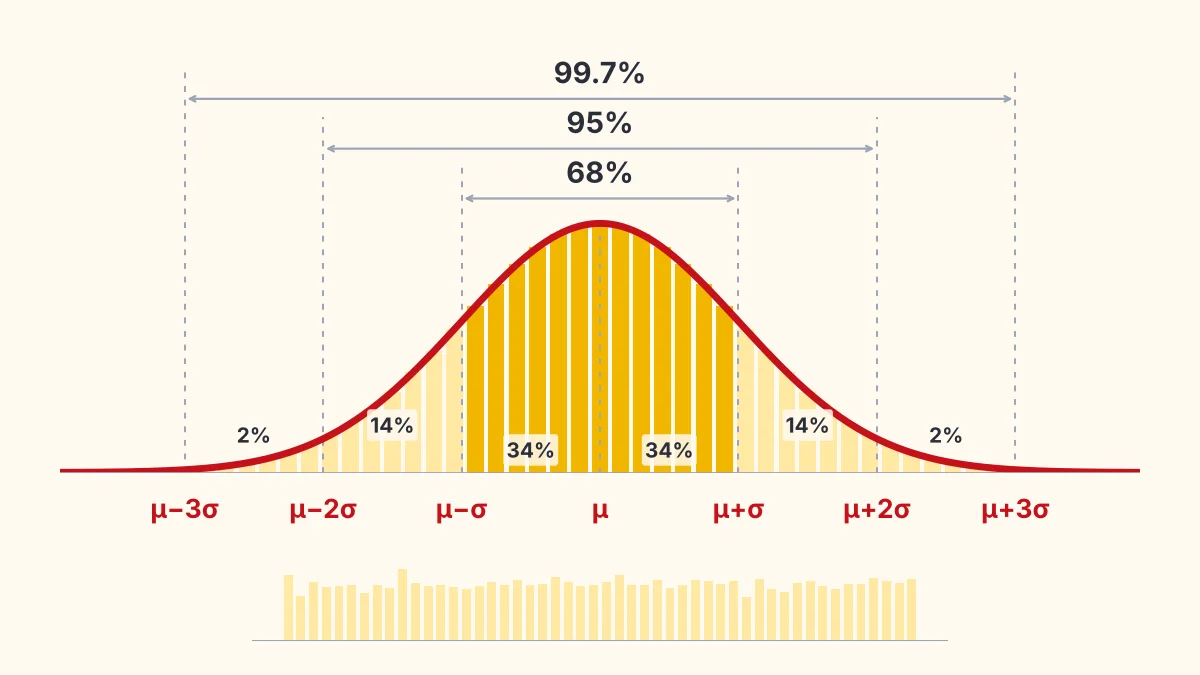
Statisticians describe a bell by its mean μ and standard deviation σ; here μ = 175 and σ = 43.2. For an exact normal distribution, 68% of values fall between μ − σ and μ + σ, 95% within μ ± 2σ and 99.7% within μ ± 3σ. Powerball sums follow this rule almost exactly: between 132 and 218 (μ ± σ), 67.6% of combinations and 67.6% of draws; between 89 and 261 (μ ± 2σ), 95.7% and 96.0%; between 46 and 304 (μ ± 3σ), 99.9% of combinations and every draw.
Why the bell gives no edge
The bell tells you how many combinations have a given sum, never which one will be drawn. A ticket with sum 175 has exactly the same jackpot odds as one with sum 15: 1 in 292,201,338. The draw lands in the central range 78% of the time because 78% of all possible tickets are there. To "cover" that range, you would have to buy 78% of all tickets.
It is like two dice: betting on a total of 5 to 9 wins 2 times out of 3, but only because 24 of the 36 possible rolls give that total. You win more often, and a fair game pays correspondingly less.
The backtest
We replayed the 1,430 draws from 7 October 2015 to 7 November 2026. In each draw, each strategy plays 10 tickets ($20). The whole thing was repeated 300 times to smooth out luck. Winnings are the fixed prizes from $4 to $1 million, without the jackpot or Power Play.
| Strategy (10 tickets per draw) | Return on prizes up to $100 | At least one prize in the draw |
|---|---|---|
| Random (quick pick) | 9.0% | 33.5% |
| Central range (sum 119 to 226) | 9.0% | 33.7% |
| Extreme sums (outside 119 to 226) | 9.0% | 33.7% |
| Spread (50 different numbers, 10 different Powerballs) | 9.0% | 39.6% |
| Clustered (4 shared numbers, same Powerball) | 9.1% | 4.8% |
| Theory, for any strategy | 8.98% | 33.7% (random) |
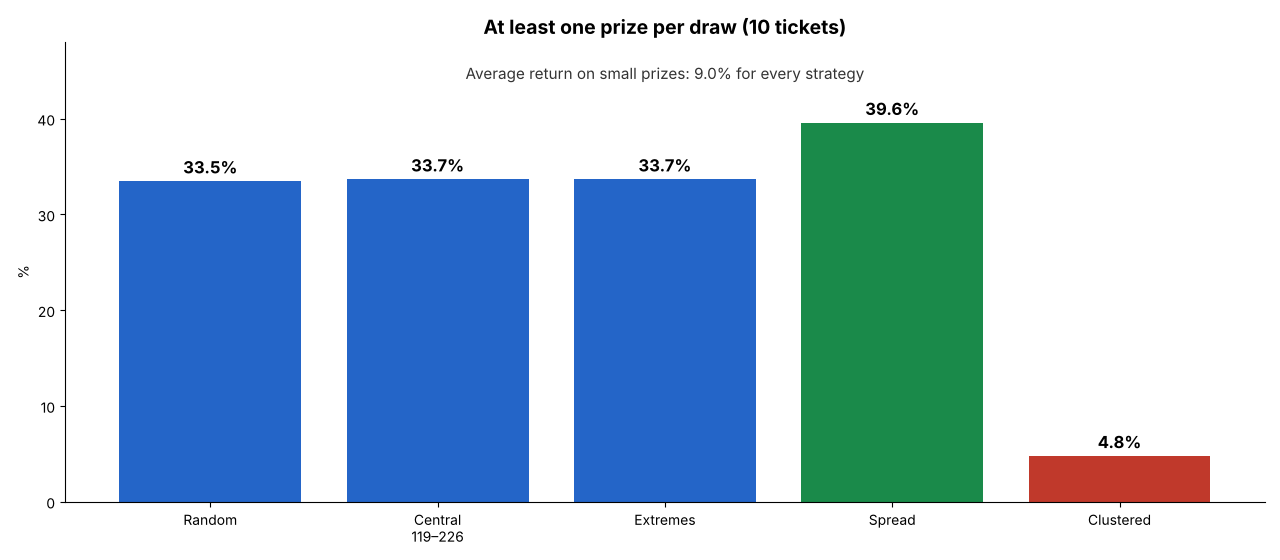
Result: the central range and extreme sums give exactly the same, and every strategy returns the same on average, in line with theory (8.98% on small prizes). Including the $50,000 and $1 million prizes, the theoretical return rises to 16%, but those prizes are too rare to be measured well in 1,430 draws.
What really makes a difference: how the tickets are built
One thing moves the numbers, and it is not the sum. Ten tickets sharing no number and using ten different Powerballs had at least one prize in 39.6% of draws, against 33.5% for ten random tickets. Ten tickets sharing 4 numbers and the same Powerball won in only 4.8% of draws, but when they won, it was often several times at once.
The average stays the same: only the distribution of winnings changes, smoother on one side, riskier on the other. That is exactly what wheeling systems do: they move the risk around, they do not beat the odds.
The only lever on the money: not sharing
In Powerball, small prizes are fixed, so sharing does not matter there. For the jackpot, though, each winner gets a share. A study of 5.1 million tickets (Wang et al., 2016) shows that players mostly pick dates, sequences and patterns. Avoiding those popular tickets does not make you win more often, but it lowers the risk of sharing.
What circulates online
On forums, the "central range" is presented as a method that "makes a profit with filters", and one piece of software sells it as "the best strategy for choosing combinations". Other work promises to predict the numbers with statistics or AI, such as a 2024 preprint tested on the South African lottery: its model hits 2 correct numbers every 12 draws, while a random ticket does so every 8.3 draws. Mathematician Marcus du Sautoy puts it well: the sequence 6 19 29 32 34 39, a 2003 UK draw, has no hidden rule; if you had guessed the 46 that followed, he suggests you play next Saturday.
Frequently asked questions
Should I play a ticket whose sum is in the middle?
It is neither better nor worse: every ticket has the same chance, whatever its sum.
Why do the sums form a bell?
Because there are many more combinations with a middle sum than with an extreme one. The draws simply follow that number of combinations.
Several tickets: is it better to use different numbers?
Different numbers and Powerballs give a small prize more often, without changing the average. Very similar tickets win less often, but sometimes several times at once.
Can filtering software make the lottery profitable?
No. Filters reduce the number of tickets you play, not the chance of each ticket. The average return stays that of the game.
Play the ticket you like, the sum changes nothing. If you play several tickets, pick different Powerballs: you will win a small prize more often for the same spend. And set your budget before you play.
All Powerball drawsAI and the lottery: what the studies sayPowerball: $847m in New Jersey
Our data: Powerball draws (Lottochaos file), current rules 5 from 69 and 1 from 26 since 7 October 2015; exact distribution of sums over all 11,238,513 combinations; backtest: 10 tickets per draw and strategy, 300 repetitions, fixed prizes without jackpot or Power Play.