The Eurojackpot bell curve: does the "central range" of sums help?
Add up the 5 winning numbers of a Eurojackpot draw and you almost always land between 89 and 166. That fact is often turned into advice: only play combinations whose sum sits in the middle of the bell. We analysed all 1,001 draws from 23 March 2012 to 6 November 2026 and replayed the idea with real prize amounts.
Which sums are in the middle?
Eurojackpot draws 5 numbers from 50. The smallest possible sum is 15 (1+2+3+4+5), the largest 240 (46+47+48+49+50), and the middle is 127.5. Of the 2,118,760 possible combinations of 5 numbers, 78.6% have a sum between 89 and 166. In the actual draws, 78.4% did. The average sum was 126.5, and half of all draws had a sum between 106 and 148.
Extremes do happen, just rarely: the lowest sum so far was 36 on 28 October 2016 (1 4 6 12 13), the highest 213 on 22 January 2021 (38 40 41 46 48). A chi-square test over the sum ranges gives p = 0.88: the sums follow exactly the curve you get from simply counting the combinations.
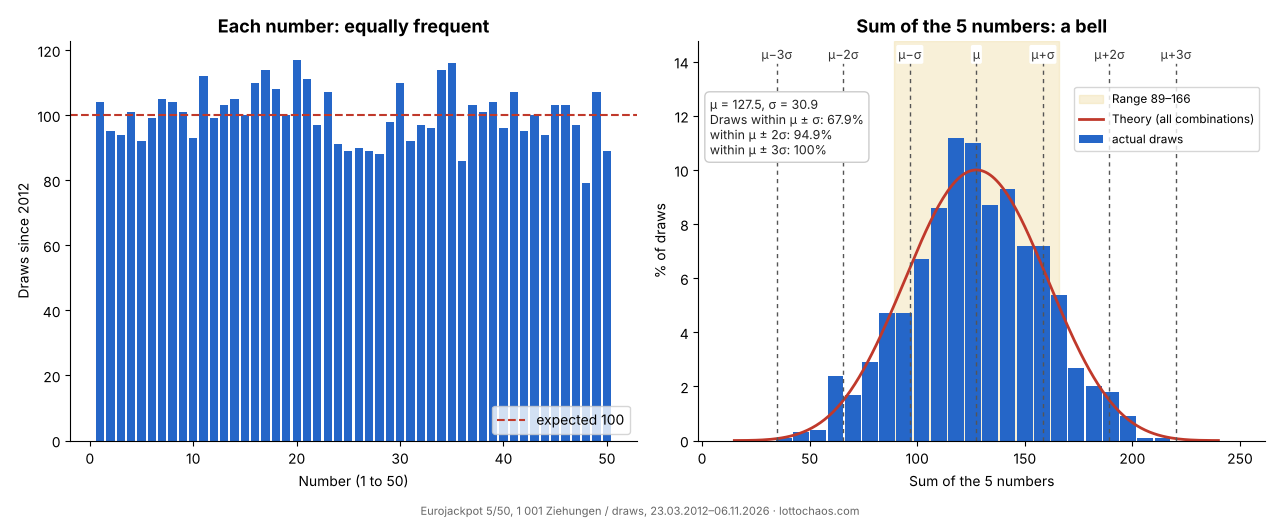
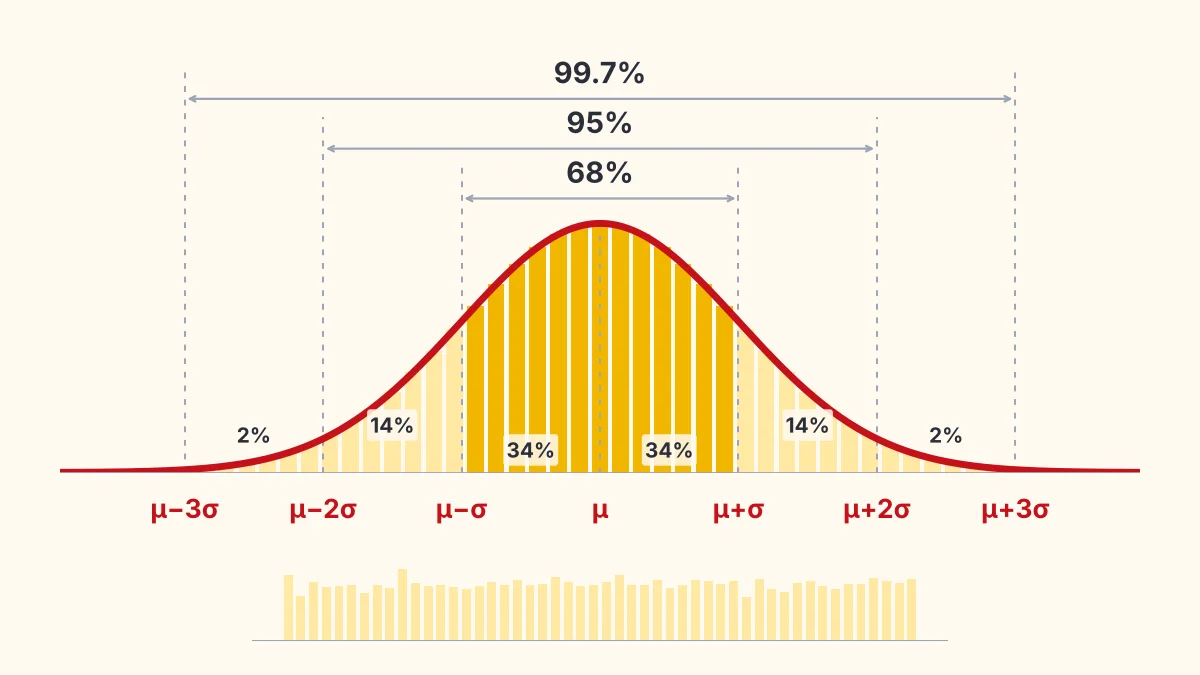
Statisticians describe a bell by its mean μ and standard deviation σ; here μ = 127.5 and σ = 30.9. For an exact normal distribution, 68% of values fall between μ − σ and μ + σ, 95% within μ ± 2σ and 99.7% within μ ± 3σ. Eurojackpot sums follow this rule almost exactly: between 97 and 158 (μ ± σ), 67.4% of combinations and 67.9% of draws; between 66 and 189 (μ ± 2σ), 95.8% and 94.9%; between 35 and 220 (μ ± 3σ), 99.9% of combinations and every draw.
Flat numbers, bell-shaped sums
Taken one by one, the numbers form no bell. Each number from 1 to 50 should come up about 100 times in 1,001 draws; the actual counts range from 79 to 117. A chi-square test gives p = 0.94: normal random variation.
The bell only appears when you add them up. A sum of 15 comes from a single combination, a sum of 127 from 26,476. It is like two dice: 7 comes up more often than 2, not because the dice prefer 7, but because six rolls give 7 and only one gives 2.
Why the bell gives no edge
The bell tells you how many combinations have a given sum, never which one will be drawn. A ticket with sum 127 has the same jackpot odds as one with sum 15: 1 in 139,838,160. The draw lands in the central range 78% of the time only because 78% of all possible tickets are there. Playing only that range means giving up 22% of the combinations, and those 22% win in 22% of draws.
The backtest with real prize amounts
We replayed 461 draws since 25 March 2022, when the Euro numbers became 2 from 12. In each draw, each strategy plays 10 tickets (€20), repeated 300 times to smooth out luck. Eurojackpot prizes depend on the number of winners, so we used the average of each prize tier over the last 90 draws (from €10.00 for 2+1 to about €209,000 for 5+0), without the jackpot and tier 2.
| Strategy (10 tickets per draw) | Return on prizes up to €300 | At least one prize in the draw |
|---|---|---|
| Random (quick pick) | 20.2% | 27.5% |
| Central range (sum 89 to 166) | 20.0% | 27.3% |
| Extreme sums (outside 89 to 166) | 19.8% | 27.0% |
| Spread (all 50 numbers once each, 10 different Euro number pairs) | 20.1% | 30.0% |
| Clustered (4 shared numbers, same Euro numbers) | 20.1% | 10.1% |
| Theory, for any strategy | 20.1% | 27.3% (random) |
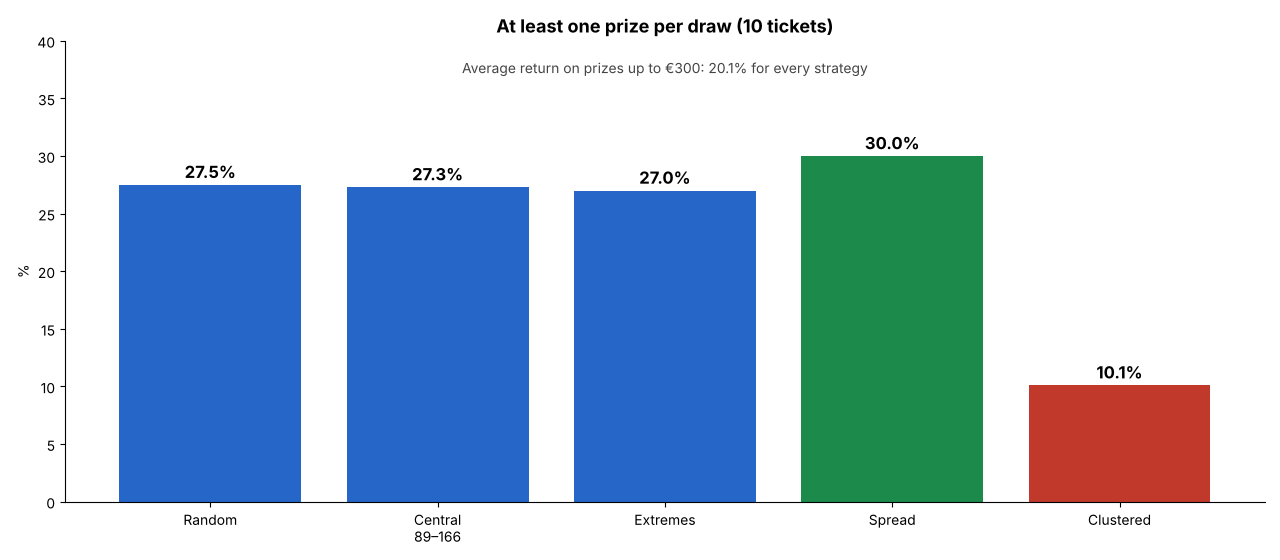
Result: the central range and extreme sums give the same. Every strategy returns about 20% of the stake on prizes up to €300, exactly as theory says. A single ticket wins something with odds of 1 in 31.8, whatever its sum. The big tiers (4+2 and 5+0) are too rare in 461 draws to be measured reliably: a single hit moves the result a lot.
What really makes a difference: how the tickets are built
Ten tickets that cover all 50 numbers exactly once and use ten different Euro number pairs had at least one prize in 30.0% of draws, against 27.5% for ten random tickets. Ten tickets sharing 4 numbers and the same Euro numbers won in only 10.1% of draws, but often several times at once. The average stays the same: only the distribution of winnings changes. That is exactly what system entries do: they move the risk around, they do not beat the odds.
In Eurojackpot, sharing matters twice as much
Unlike Powerball, Eurojackpot has no fixed prizes: in every tier, the pot is split among all winners. If you play the same numbers as many others, you get less when you win. A study of 5.1 million tickets (Wang et al., 2016) shows that players mostly pick birthdays, sequences and patterns. Only 8.0% of all combinations consist solely of numbers up to 31, yet that is where birthday tickets crowd together. Avoiding such tickets does not make you win more often, it makes you share less often. The sum plays no part in this: 1 2 3 4 5 is an extreme sum and is still played by thousands.
Frequently asked questions
Which sum is most common in Eurojackpot?
In theory 127 and 128, each with 1.25% of all combinations. Any single sum is rare; only the range 89 to 166 covers 78.6%.
Should I only play tickets with a sum between 89 and 166?
It is neither better nor worse. Every ticket has the same chance whatever its sum; our backtest shows no difference.
Do the Euro numbers count in the sum?
No, the bell refers to the 5 main numbers. The two Euro numbers (2 from 12) have their own, much narrower distribution from 3 to 23.
How often was the sum below 60 or above 200?
Rarely: in 1,001 draws it was below 60 fifteen times and 200 or more four times, roughly as often as the number of combinations predicts.
Play the ticket you like, the sum does not change your odds. If you play several tickets, use different numbers and Euro numbers: you will win a small prize more often for the same spend. Avoid birthday tickets so you share less often if you win. And set your budget before you play.
All Eurojackpot drawsEurojackpot statisticsThe same test with Powerball
Our data: 1,001 Eurojackpot draws from 23.03.2012 to 06.11.2026 (Lottochaos file); exact distribution of sums over all 2,118,760 combinations of 5 from 50; backtest: 461 draws since 25.03.2022 with Euro numbers 2 from 12, 10 tickets per draw and strategy, 300 repetitions, average prizes of tiers 3 to 12 over 90 draws (30.12.2025–06.11.2026), without jackpot and tier 2, €2 per ticket without fees. Script: tools/ej_bell_backtest.py.