SA PowerBall in numbers: facts for the press
Up-to-date, quotable SA PowerBall key figures, calculated automatically from the official draw results, as of 20/10/2026. You may reuse the texts and the chart freely with the credit “Source: Lottochaos.com” and a link to this page.
1 : 33.900.160
The odds of winning the SA PowerBall jackpot are 1 in 33.900.160 per line.
325.963 years of waiting
Playing one line in every draw (104 draws a year), it would take on average about 325.963 years to hit the jackpot once.
1 : 14,9
In SA PowerBall, roughly one line in 14,9 wins a prize of any kind (odds 1 in 14,9).
1.229 draws
Since the first draw on 02/01/2015, SA PowerBall has held 1.229 draws.
13 107×
The most drawn SA PowerBall number is 13: 107 times in 870 draws since 19/06/2018 (expected by pure chance: 87,0).
1 65×
The least drawn is 1: 65 times in 870 draws since 19/06/2018 (expected: 87,0).
31 draws absent
Number 32 has not been drawn for 31 draws (last on 03/07/2026). That does not make it “due”: every number has the same chance in every draw.
81 draws absent
Longest absence of a number since 19/06/2018: 26 missed 81 draws in a row (16/06/2020 to 02/04/2021).
19 + 24 23×
The most frequent pair is 19 and 24: drawn together 23 times (expected: 7,1).
11 6×
PowerBall: 11 is the most frequent (6 times since 02/06/2026).
112,0 Mio. R
The biggest tier-1 prize since 12/06/2026 was 112,0 Mio. R (draw of 13/10/2026).
0
No SA PowerBall winning combination has ever been drawn twice (1.229 draws).
Chart: how often has each number been drawn?
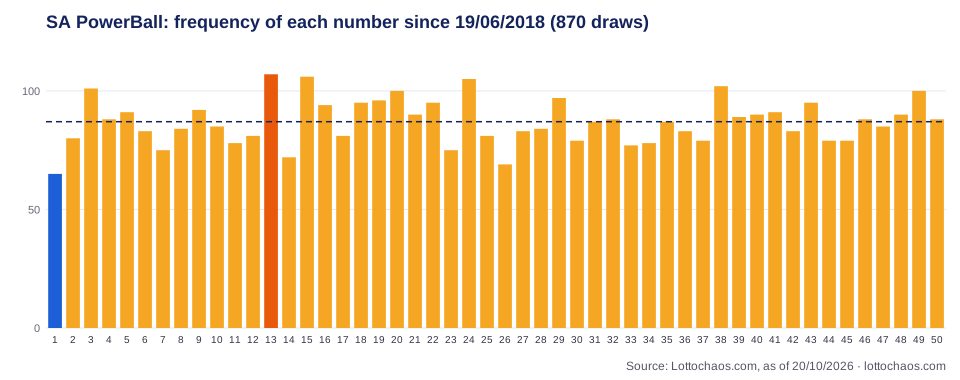
The dashed line shows the value expected by pure chance. Deviations of this size are normal in genuinely random draws.
Method and sources
Figures are based on the official draw results and prize breakdowns of the operators and are recalculated automatically after every draw. Frequencies refer to the current 5/50 format (statistics since 19/06/2018). Lottochaos is an independent statistics site with no gambling offer; past draws do not allow any prediction.
Use
You may reuse texts, figures and the chart freely (licence CC BY 4.0) with the credit “Source: Lottochaos.com” and, ideally, a link to this page. Raw data, custom analyses or questions: see the contact details in the Note legali.